Debugger for Velt SDK
Discovery
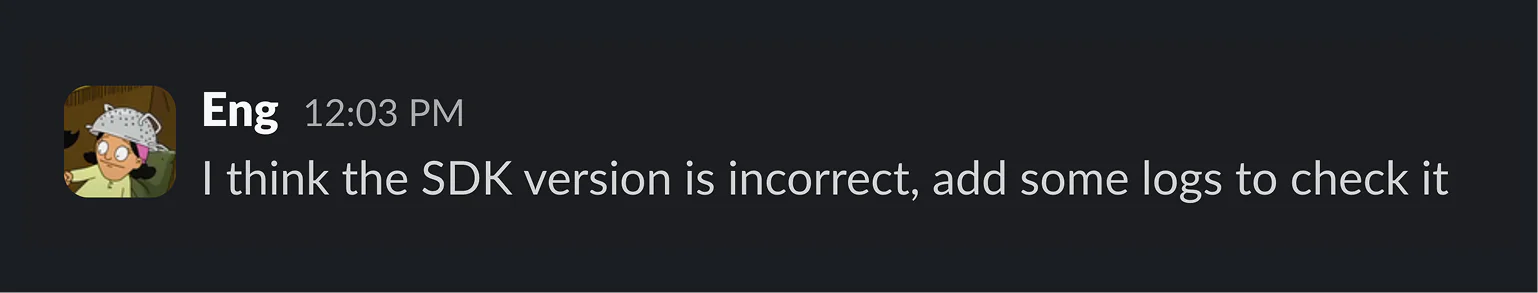
Velt Debugger wasn't a planned task. After hearing our engineering team talking about how they spent time
- Adding logs to find the right version of SDK
- Searching which components are installed
- Filtering network request
- and more
This setup usually takes 15minutes and then tweaking everytime they make a change which eats up a lot of their time.
So over the weekend I built a simple version to solve some of the issues.
Building the V1
The initial version that was presented to the team had 3 tabs
- Overview
- Data
- Component
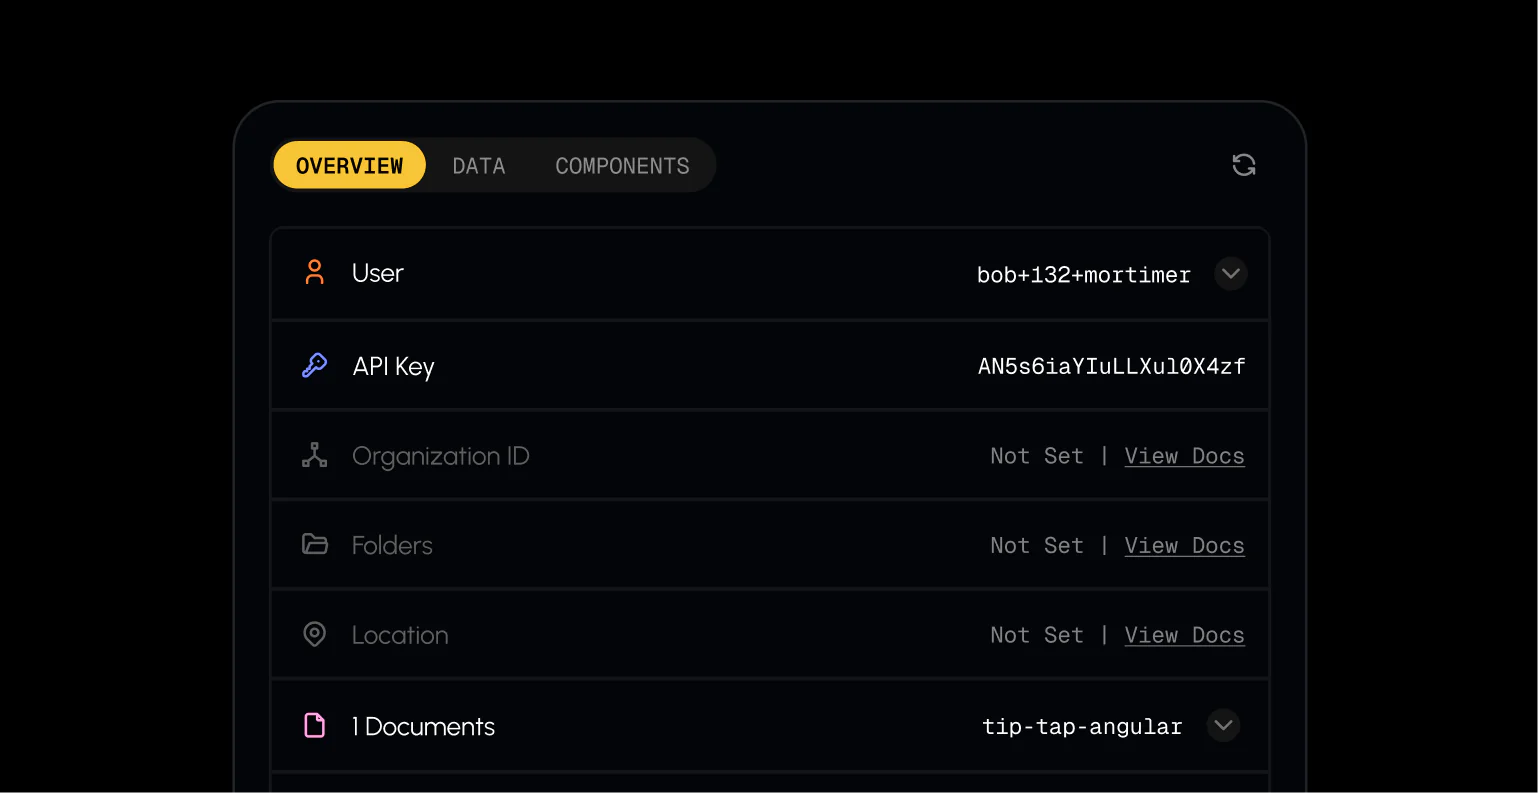
Overview Tab
This would show our team what is they API Key, which user is logged in and additional details regarding the Velt SDK
Users can easily copy the values directly from the extension as well as deep links to our database where the client's data is saved
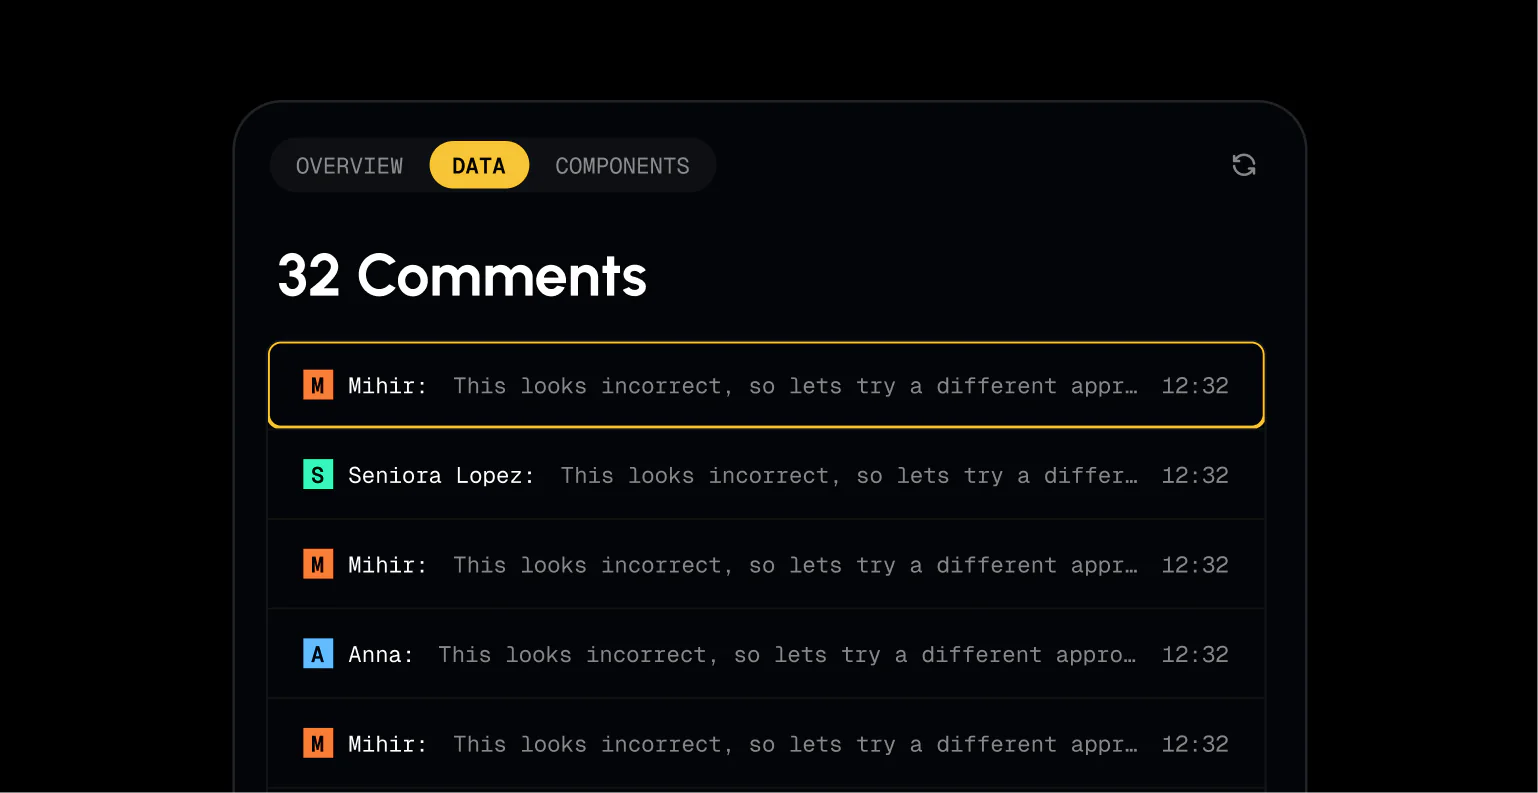
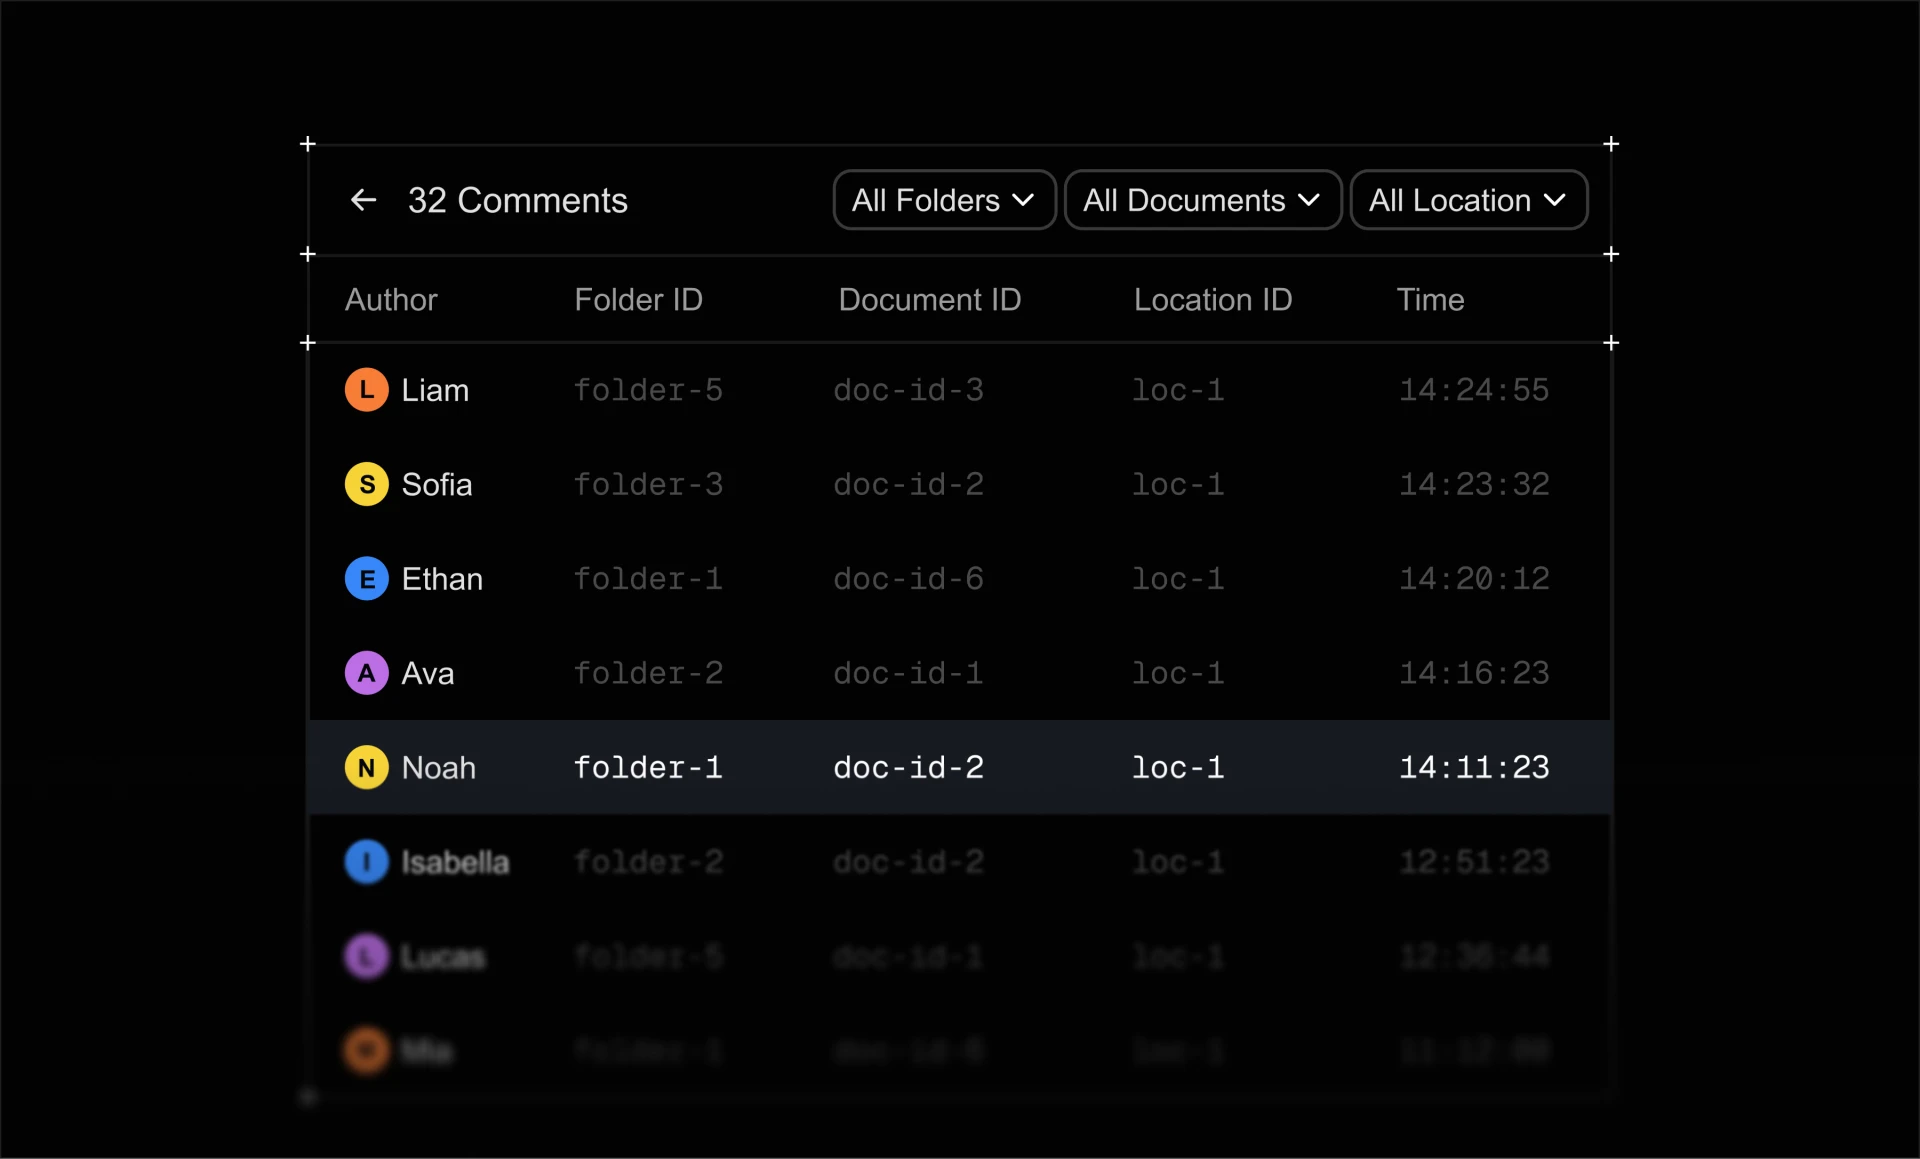
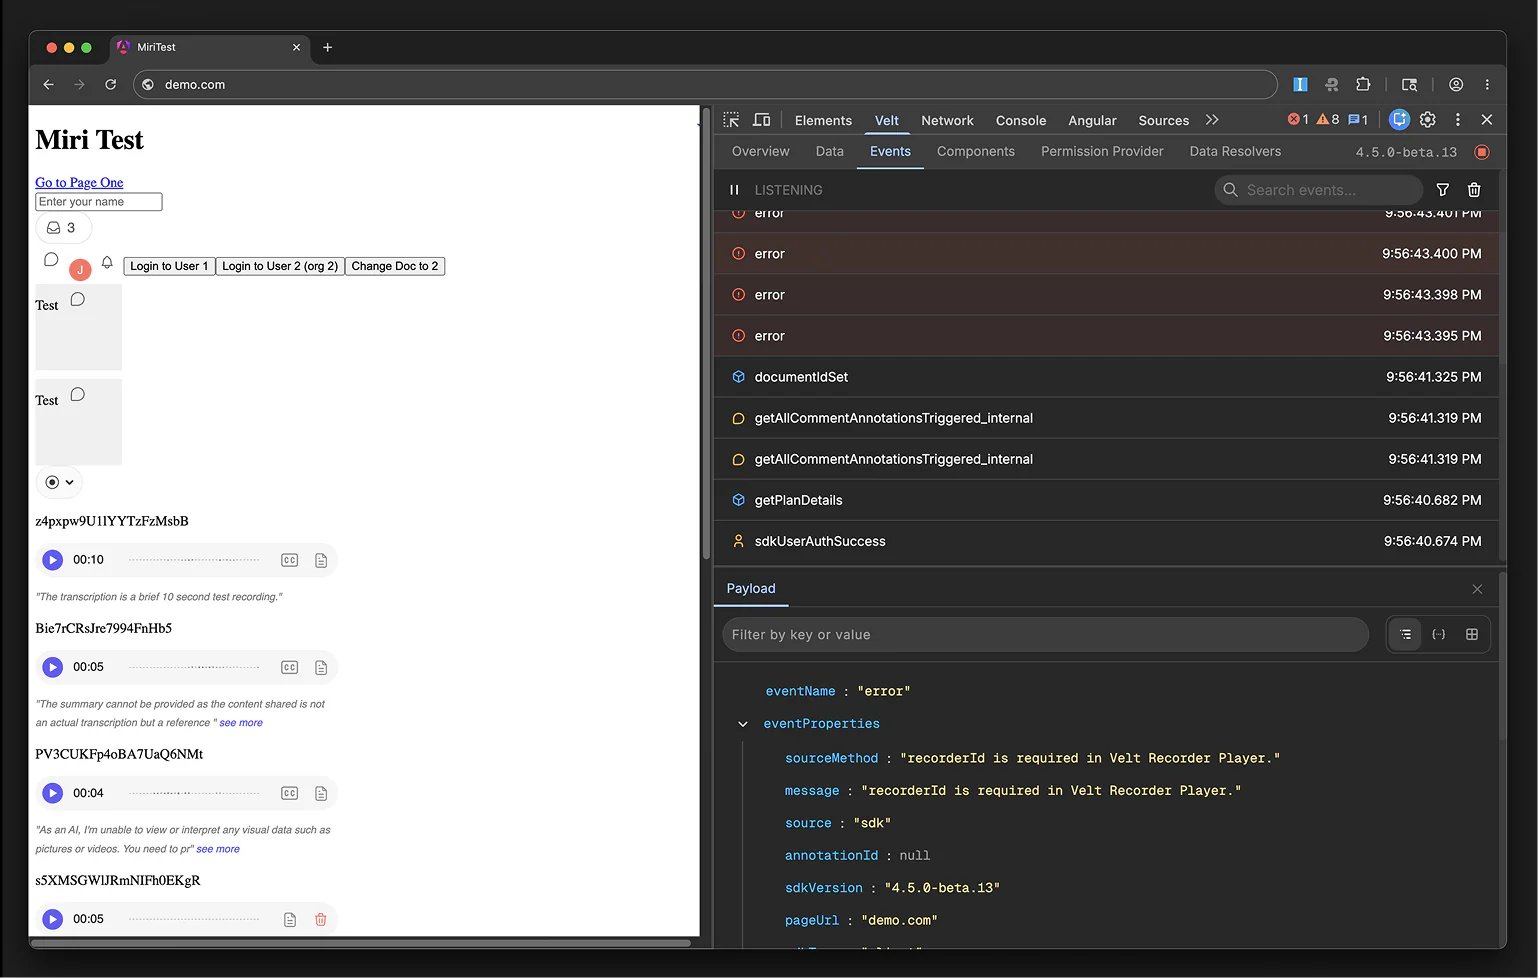
Data Tab
In the initial version I just had data from comments feature as this is one of the popular features that we offer at Velt.
This just lists all the comments data from the current page and show it to the user
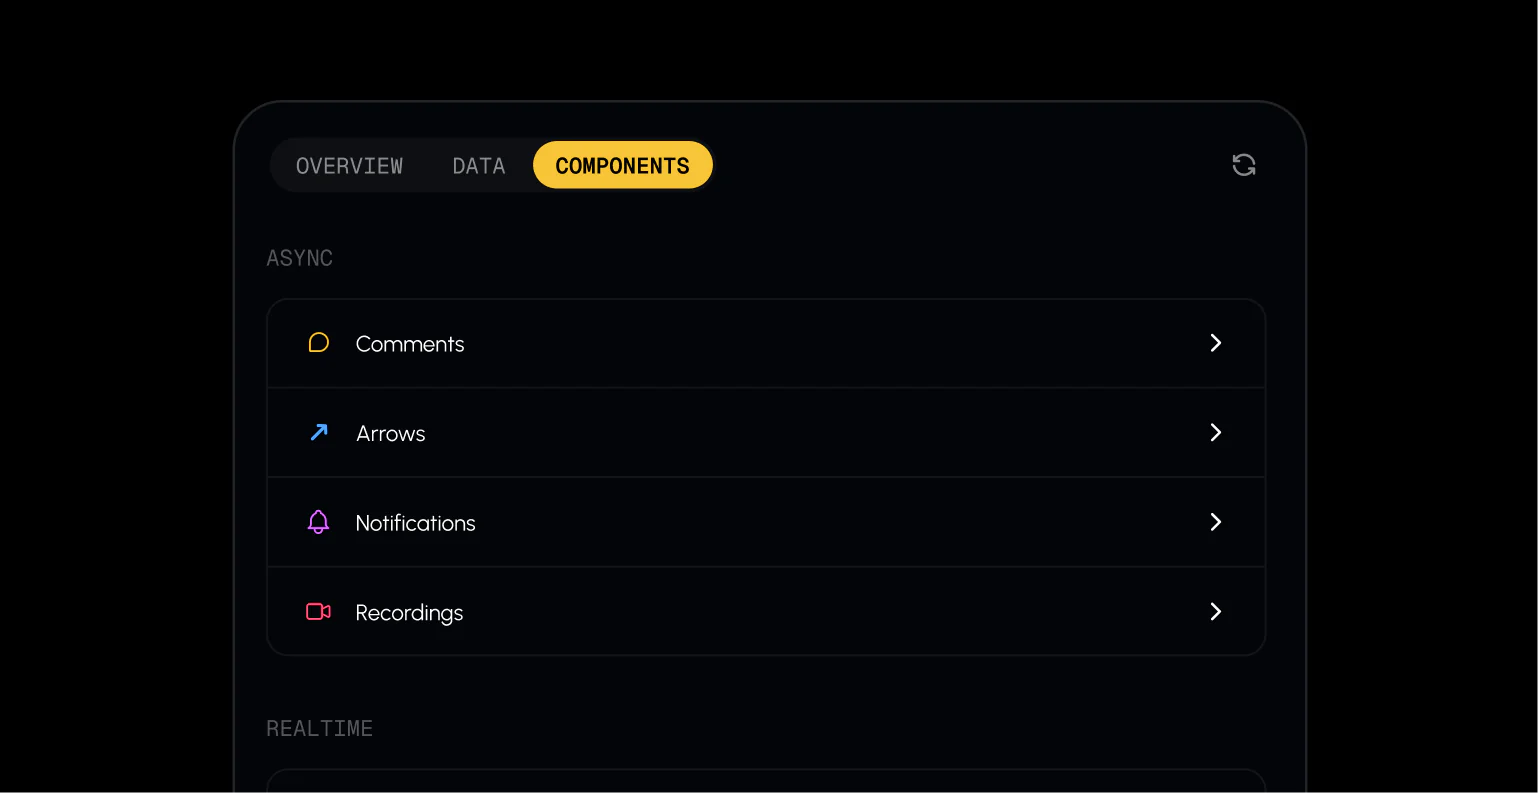
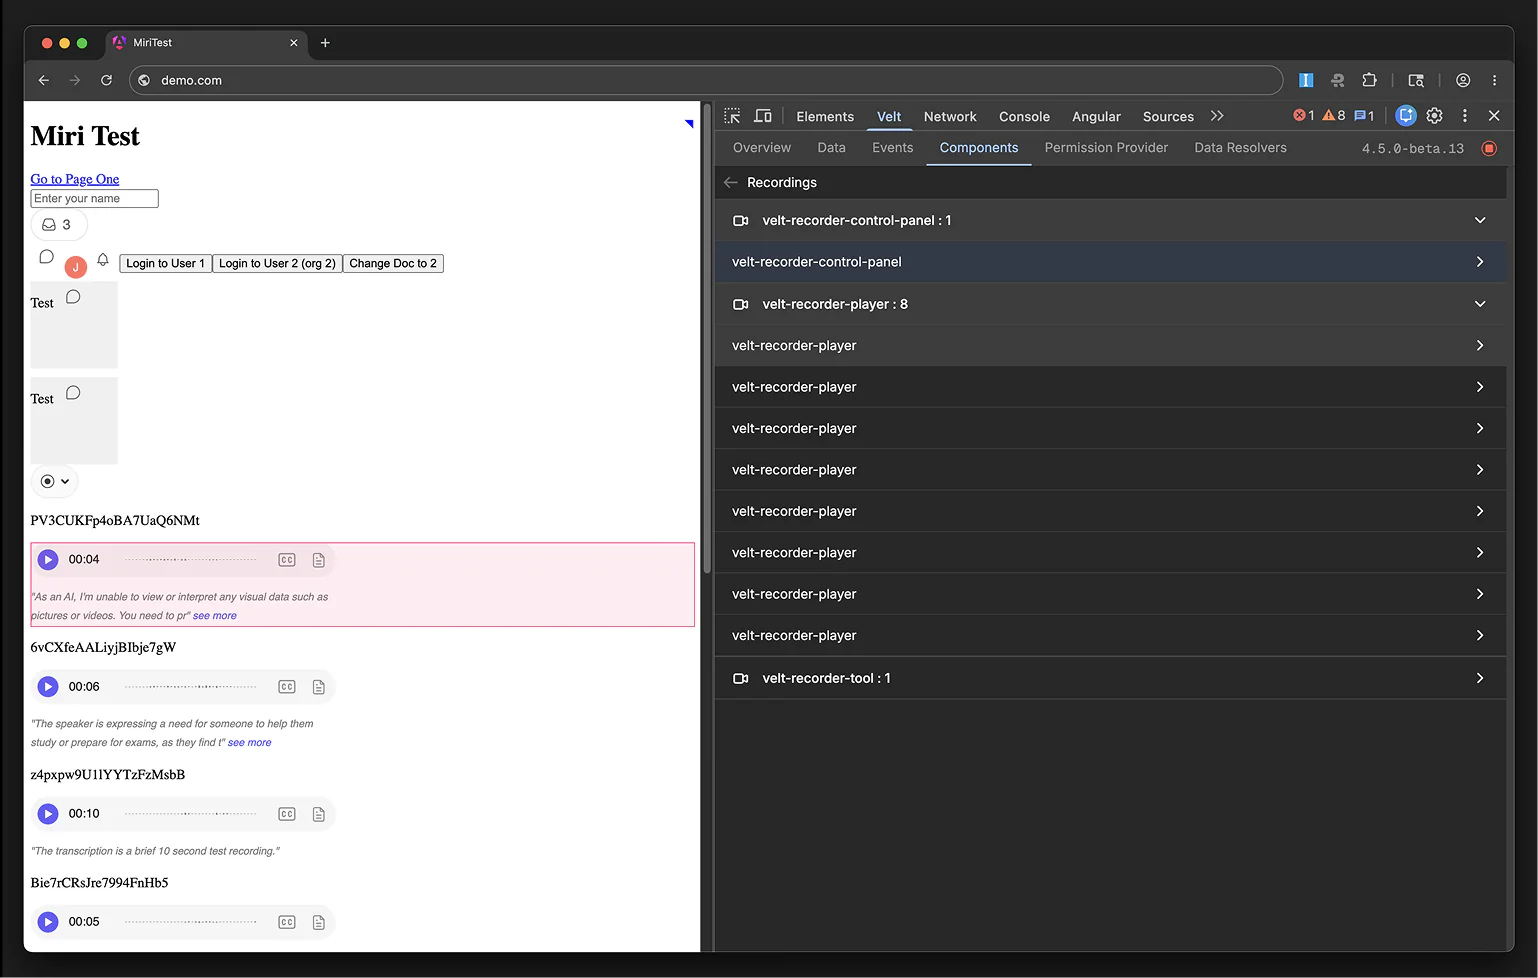
Components Tab
This tab lists all the components found on the current page and then lists them. By clicking on the component it will scroll that component into view
After presenting the v1 to our founder and the engineering team, I got an overwhelmingly positive response from everyone and was asked to build a V2 which covered all the issues that we had
Finding Blockers
Next step was to identify all the blockers that can be solved and try to cover debugging for as many features as possible.
After discussing with the team we came up with the product spec
Mini Product Spec
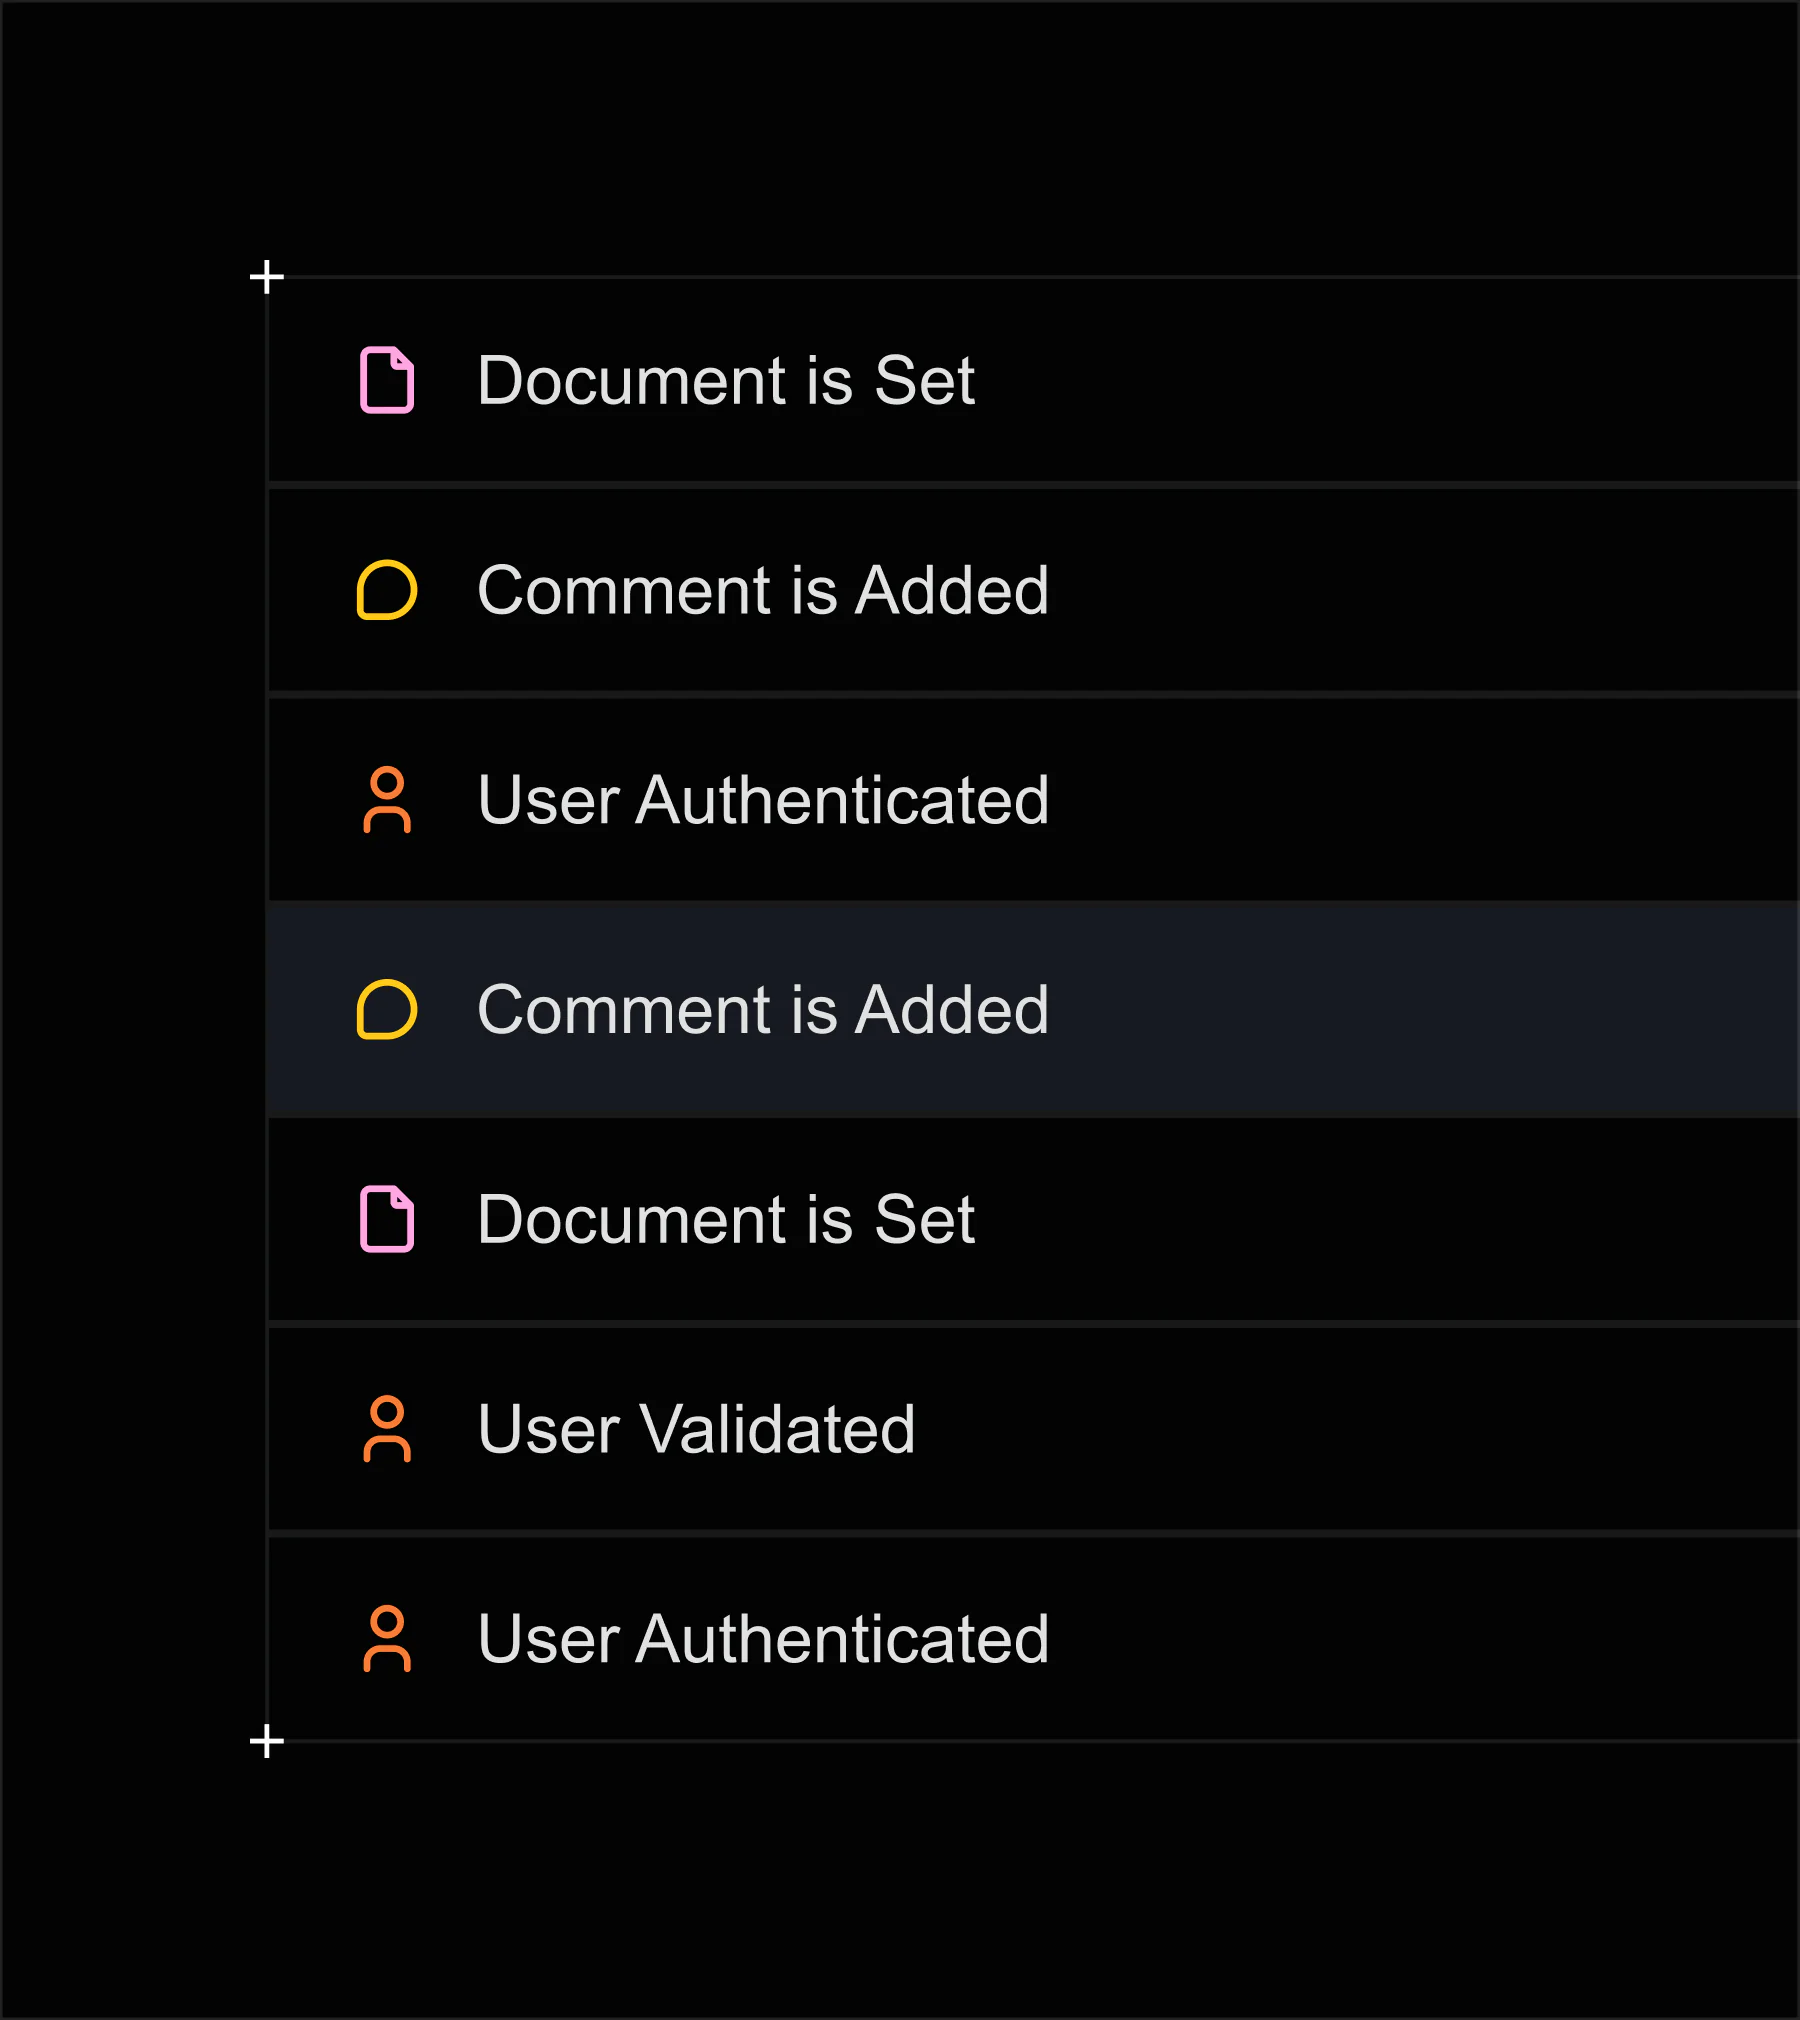
- 8+ Features to cover - comments, notifications, CRDT and more
- Ability to change the SDK version
- Adding customer side control to turn debugging on or off
- Adding link to docs for wherever we detect errors
- Support for network requests
- Overall filtering by feature and data types across all tabs
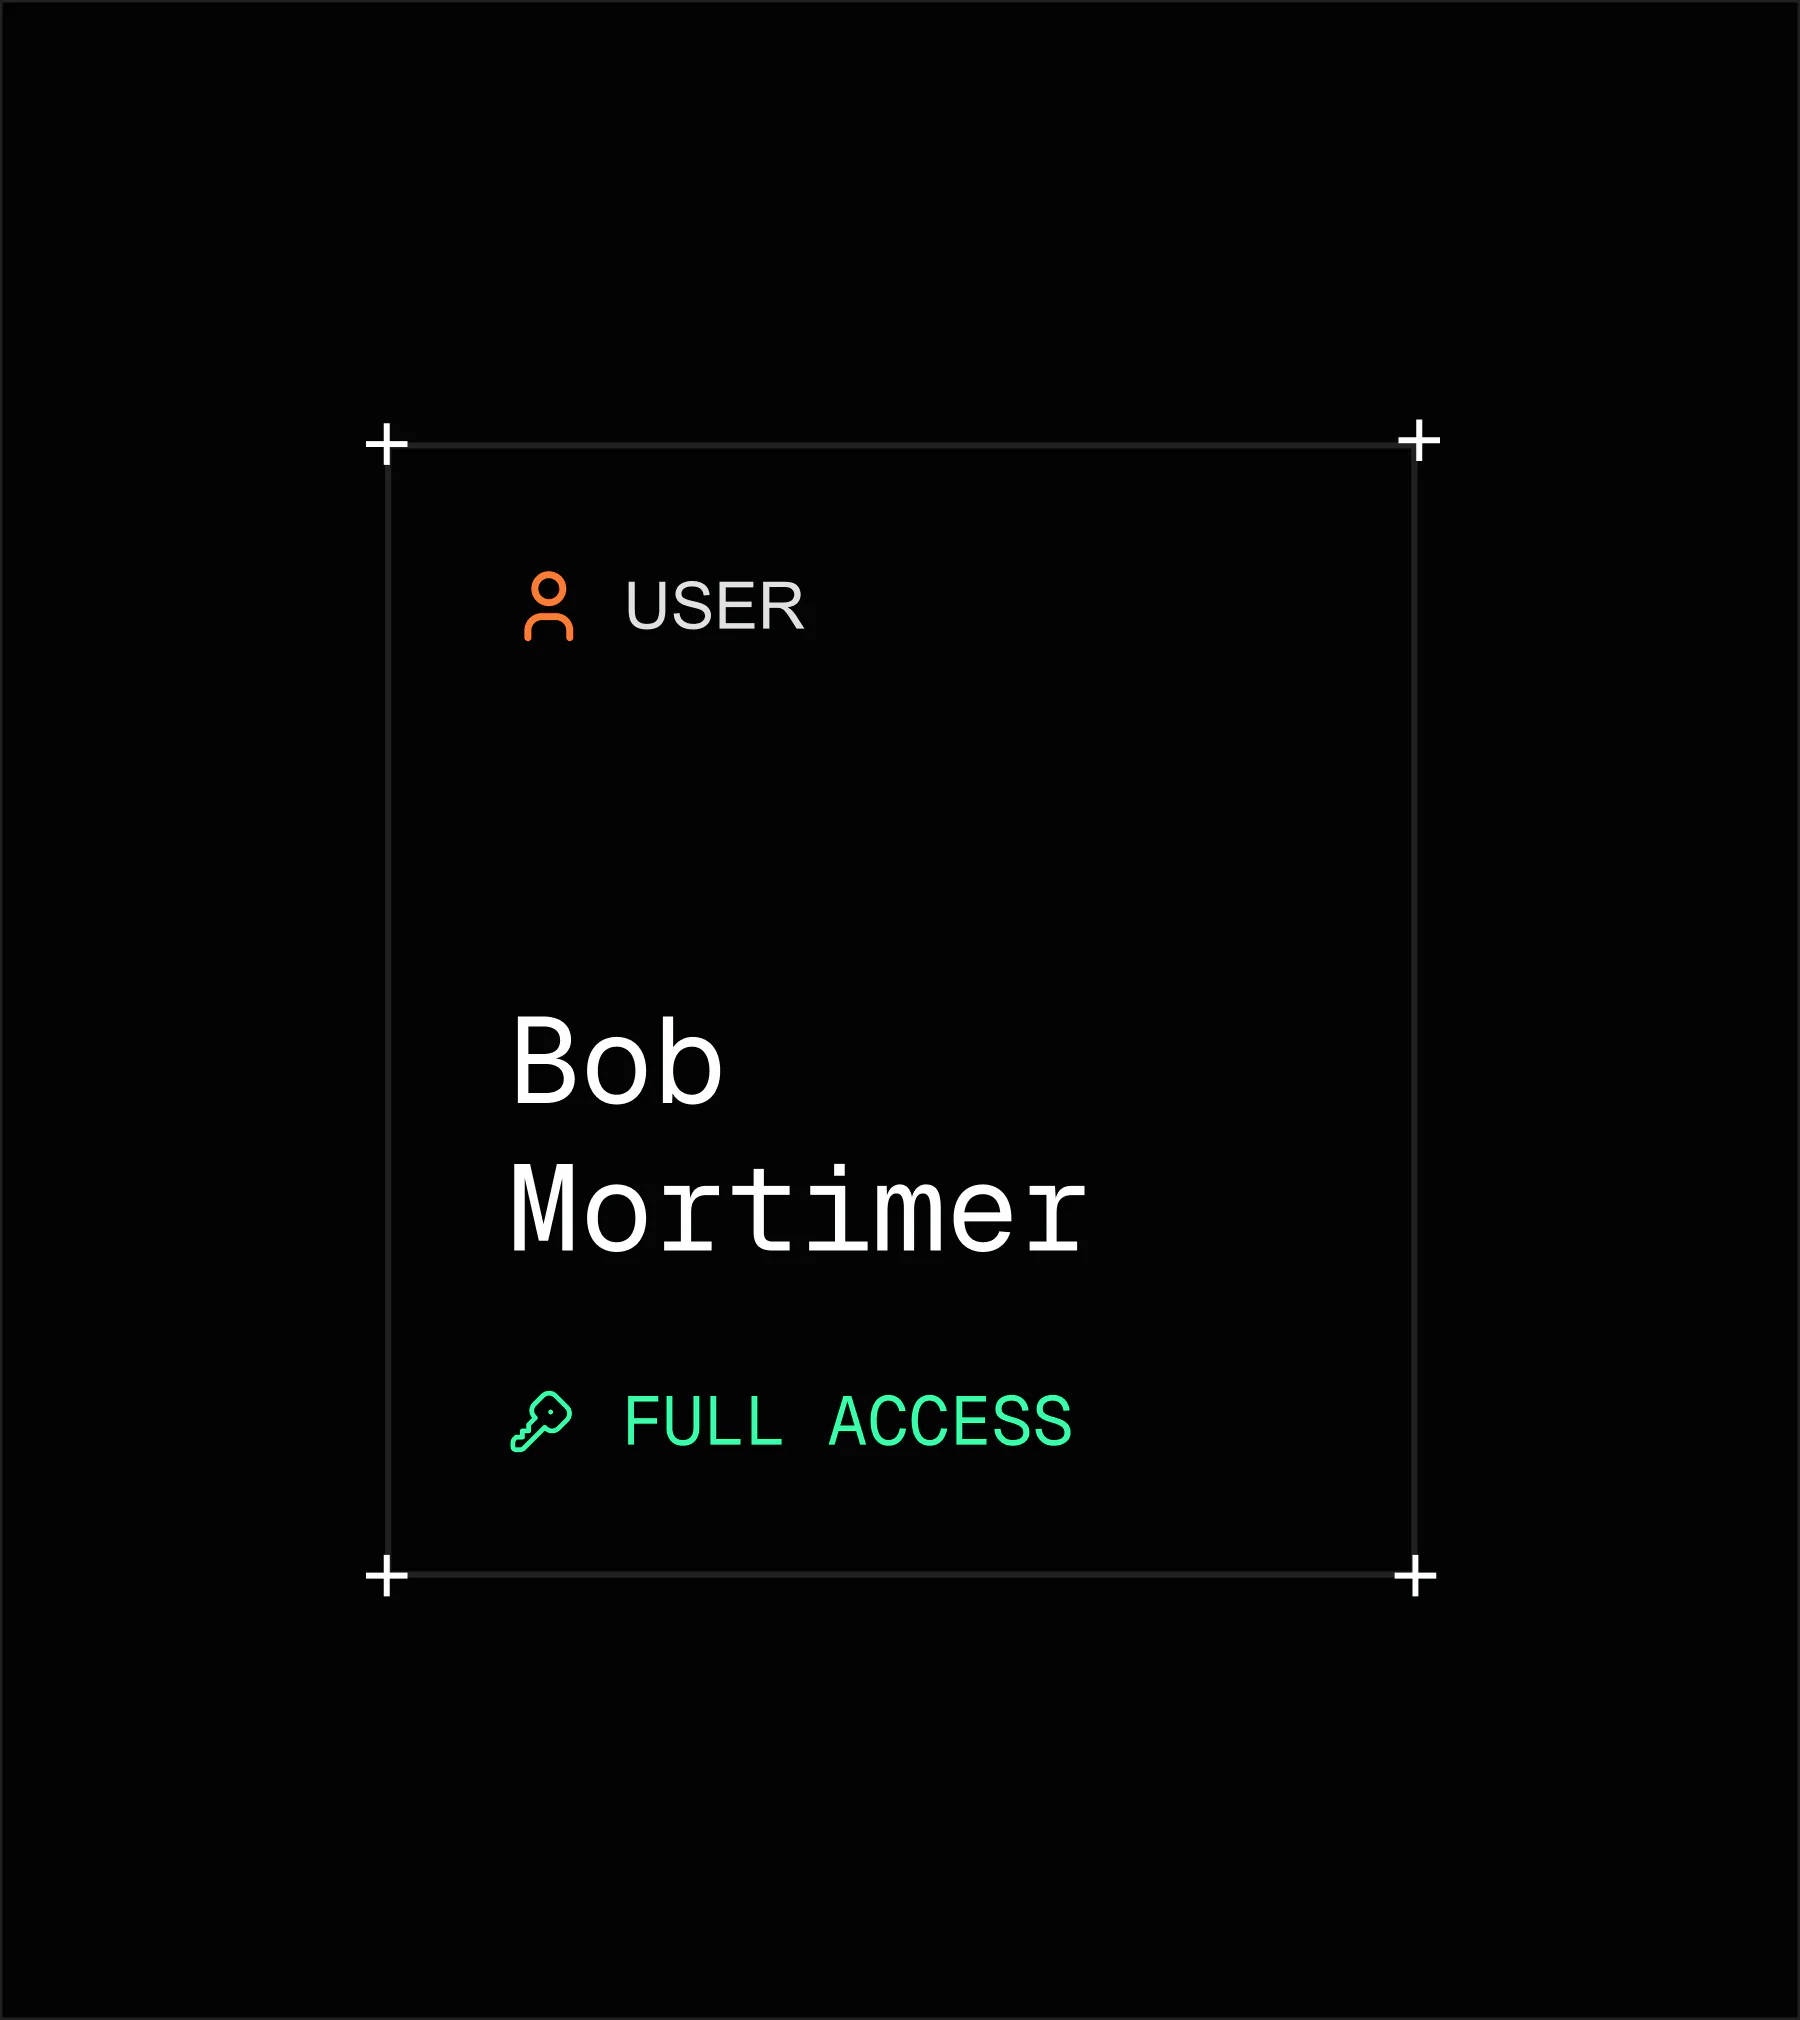
- Showcasing User permissions
- Highlighting the components on the DOM
- Ability to run function for features from debugger
Note: original spec was obviously longer
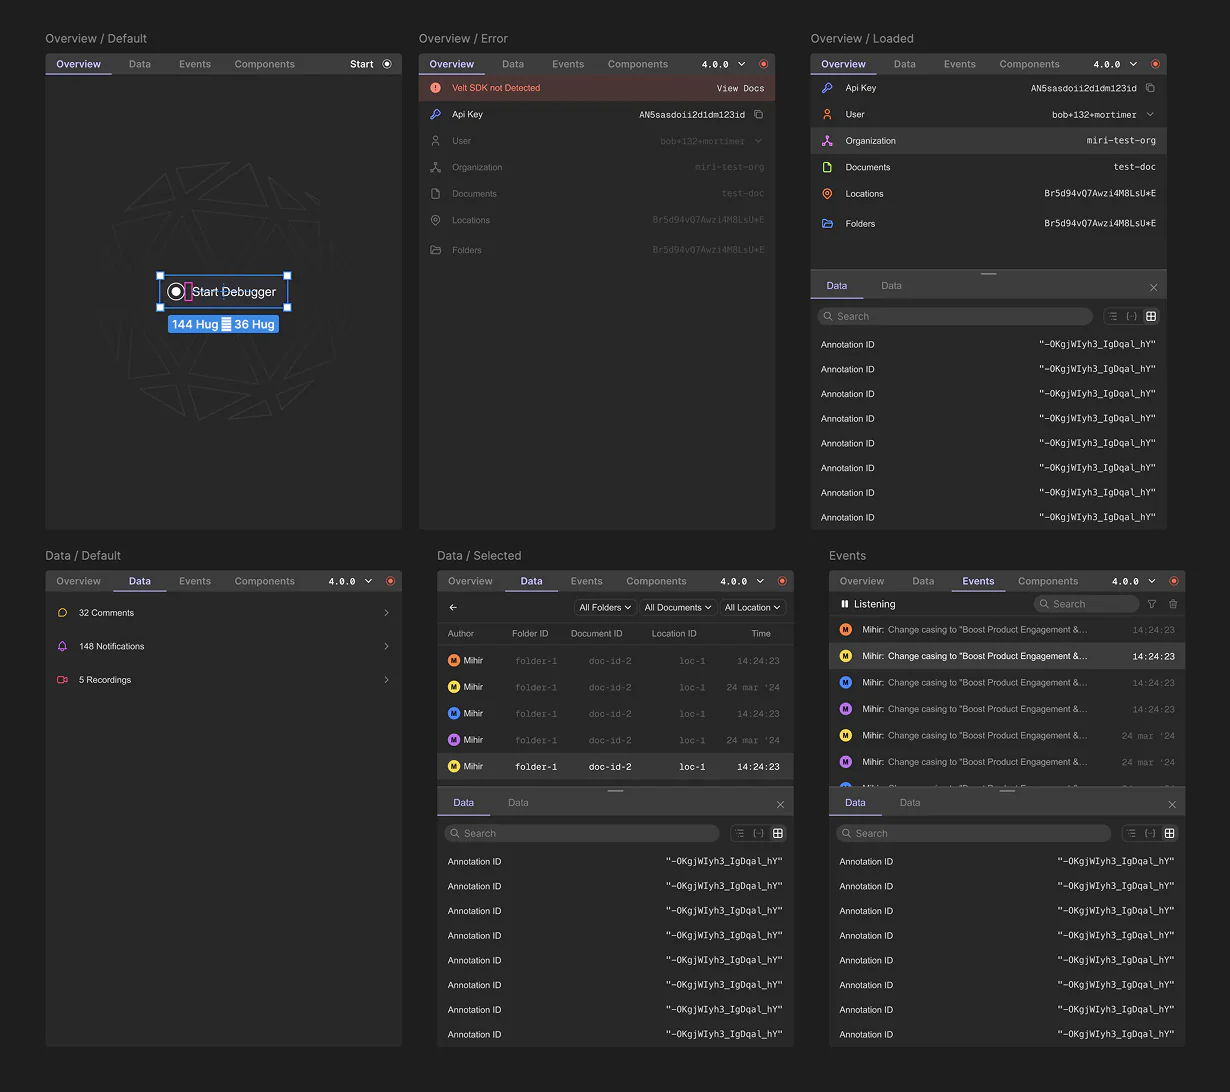
Designing Debugger
The original designs I had its own unique aesthetic which stood out too much.
For the redesign I tried to follow the developer console aesthetic that already exists. cool grays and muted blues along with bottom drawers.
Building V2
After redesigning the UI, I got back to work. In the first version I wrote a bit of hacky code to get data from SDK but now in this version I wrote a cleaner code.
As I built the version 2 of the Chrome extension, I ran into some issues so got engineering team involved to make changes on the SDK to provide additional debugging details for the debugger.
Later in the stage new engineer joined me in the project and we were able to launch within 1.5 months.
Launch Video
To launch our debugger to the public I storyboarded and built a launch video.
The video inspiration came from 16 years old music called Born Free from MIA, the intro of the music had this cool drum rolls which became the heart of the launch video.